

Australia’s love for cars isn’t new—Aussies have always been eager to jump behind the wheel and cruise through the country’s scenic routes. Nevertheless, the COVID-19 pandemic resulted in movement restrictions that saw everyone remain indoors for a while, impacting vehicle sales in Australia.
This article sheds some light on the recent Australian car sales stats to give an insight into the most popular car brands and types among Aussies. Let’s dive in!
Australia’s Key Car Sales Stats at a Glance
- In 2020, 926,968 vehicles were sold in Australia
- Toyota is the most popular car brand in Australia
- Oz vehicles sales grew 33.1% YOY (Year-on-Year) in 2021 August
- 33% of Australian new vehicle sales occur in NSW (New South Wales)
- In 2020, 49.6% of the vehicles sold in Australia were SUVs
- In 2018, 356,230 of the new cars sold in Australia were from Japanese manufacturers
- In the first half of 2021, 8,688 electric vehicles were sold in Australia
- In 2020, hybrid car sales in Australia almost doubled
- Aussies pay an average of 10811 AUD for second-hand vehicles
- On average, Aussies spent 40128 AUD on a new car in 2020
General Australian Vehicle Sales Stats
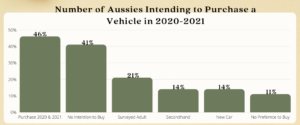
1. Number of Ozzies Intending to Purchase a Vehicle in 2020-2021
According to Statista, 46% of Australians intended to purchase a vehicle between 2020 and 2021.
21% of adult Australians surveyed between 2020 and 2021 indicated they were in the market for a new vehicle, while 14% intended to purchase a second-hand one. 11% of the respondents had no preference for buying a used or new vehicle.
On the other hand, 14% of those surveyed indicated that they weren’t sure if they’d buy a new car in the year ahead, while 41% of the respondents had no intentions of purchasing a car.
2. Cars That’ll be Operational in Australia By 2025
Statista indicates that the number of operational vehicles per 1000 Aussies is expected to remain the same by 2025.
In 2021, it was established that the number of vehicles driven per 1000 in Australia was around 571.37. There aren’t any significant fluctuations expected in the country’s car park in the next three years, only a slight decrease to 570.93.
Whether the forecasts will pan out remains to be seen, as, in a 2020 survey, 29% of Australians admitted that COVID-19 had made them rethink the number of cars their households required.
3. Number of Vehicles Sold in Australia Every Year
According to Dinggo and FCAI, in 2020, 916,968 cars were sold in Australia. Between 2011 and 2020, 11.247 million new cars rolled out of dealerships; the yearly peak was in 2013, with 1.36 million car sales.
Nevertheless, in 2020, FCAI (Federal Chamber of Automotive Industries) recorded less than a million new car sales in Australia for the first time in ten years.
New vehicle purchases dropped sharply compared to the previous year where 1, 062 867 cars were sold. The 13.7% decrease was brought about by the financial implications of the COVID-19 pandemic.
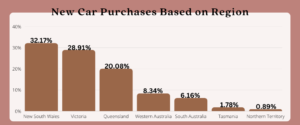
4. New Car Purchases Based on Region
According to Statista, around one-third of new vehicle purchases in Australia happen in NSW (New South Wales). The region had a 32.17% in Australia’s new vehicle market share in 2018, with Victoria coming in a close second with a 28.91% share.
Queensland came in third at 20.08%, while Western Australia had an 8.34% market share. Other regions like South Australia and Tasmania had 6.16% and 1.78% of the total new vehicle market share, respectively. The region with the least number of new vehicle purchases was the Northern Territory which only had 0.89% of the market share in the same year.
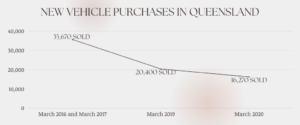
5. New Vehicle Purchases In Queensland
Data from Queensland established that in the year leading to March 2020, only 16 270 cars were bought in Queensland.
New car sales dropped sharply in Queensland between 2017 and 2020. Between March 2016 and March 2017, 35 670 cars were sold in Queensland, dropping to 20 4000 by March 2019, and the trend continued in 2020.
6. Age Group That’s Likely To Purchase a New Car
According to Ray Morgan, Australians over 50 are most likely to purchase a new car.
48% of Aussies who intended to purchase a new vehicle in 2019 were above 50; this is a 10% increase compared to ten years ago.
Over the last decade, vehicle buyers above 64 have doubled from 9% to 18%. 22% of new vehicle buyers were below 35, a decline from the 28% registered a decade earlier.
7. What Aussies Consider Before Purchasing A Car
According to Statista, an essential consideration for Australians when purchasing a vehicle is its safety.
A survey between 2020 and 2021 established that 65% of adult Australians cared more about a car’s safety, while 64% were most concerned about fuel efficiency. Additionally, 52% of the respondents cared most about cars being suitable for everyday use, while 46% cared about quality.
45% of the respondents gave answers revolving around ensuring that Australian automotive firms had excellent customer service, a good warranty, comfortability while driving, and affordability.
36% of the respondents valued a car’s design, while 37% were more concerned about how much space a car had. Things like if the vehicle was eco-friendly and the brand were down in the buyer priority list, with only 26% and 23% of the respondents caring about them, respectively.
Vehicle Sales by Model Stats
8. Popular Vehicle Brands in Australia
According to Statista, the most popular vehicle brand in Australia is Toyota. A survey conducted in 2019 established that 16.8% of Australians above 14 who planned to buy a new car in the next four years wanted a Toyota.
Additionally, a survey between 2020 and 2021 shows that 19% of respondents between 18 and 64 said they had a Toyota car in their household.
9. Most Popular Vehicle Model In Australia
Data from FCAI indicates that 49.6% of all vehicles sold in Australia in 2020 are SUVs. In 2020, Australia’s automotive sector didn’t record any significant shift in customer preferences, as
Ozzies mainly purchased SUVs. 454,701 SUV units were sold throughout 2020; this number was 5.9% less than those sold in 2019. However, it was up 4.1% concerning market share.
The second most popular car type was light commercial cars with 205, 597 units sold in 2020 and a 22.4% market share. In third place were passenger cars, with a 24.2% market share and 222,103 units bought.
10. Popular Car Manufacturers in Australia
According to Statista, in 2018, 356,230 new vehicles sold were from Japanese manufacturers. Considering Toyota was the most dominant brand for 18 years, it should be no surprise that Japanese manufacturers are popular in Australia.
Thailand comes in second with 300,270 new vehicle sales in 2018. Korean manufacturers are third, with 169,320 cars bought. 91, 410 new vehicles from German manufacturers were sold in 2018, while 4,220 new cars from American manufacturers were bought in the same year.
11. Top-Selling Vehicle in Australia
Research conducted by Statista and RACV established that in 2020, four out of the top ten leading cars were made by Toyota. A 2020 review of the top-selling vehicles in Oz supports this research, with 204,801 Toyotas sold; this is two times more than the second top-selling brand, Mazda.
As of 2020, Toyota has dominated Australia’s car market for 18 years. Additionally, for five subsequent years, Toyota Hilux vehicle sales led the charts; in 2020, 45,176 units were sold.
RAV4 was the third top-selling vehicle, with 28,357 units purchased; the brand was also the best-selling SUV in Australia in 2020. The fourth most popular vehicle in Australia that year was Corolla which sold 25,882 units. The Prado (another Toyota Car) came in eighth with 18,034 units.
12. Brand With The Best Customer Support
According to Cars Guide, Mazda had the best after-sales customer support in 2019 out of all vehicle companies in Oz. The brand garnered 818 points solidifying its top position in the yearly JD Power Customer Support Report.
The brand has topped this category for four years in a row. Toyota came in second with 799 points, while Honda and Hyundai came in third and fourth with 793 and 790 points, respectively.
Among the luxury vehicles, Audi came first with 802 points, while Mercedes Benze was the first runner-up with 796 points. BMW came in third with 790 points and was below the 798 points luxury average.
13. Electric Car Sales
Reports from Statista indicate that in the first half of 2021, 8,688 electric cars were sold in Australia. This is in comparison to 3,226 electric cars sold in 2020 in the same duration. The cars sold in 2021’s first half outperformed 2019’s full-year record, where 6,718 units were sold.
This is excellent news since Australia has the lowest electric vehicle ratios per 1000 of the population among developed countries. Australia’s ratio stands at 0.5, while countries like Norway have 81 electric cars for every 1000 inhabitants.
14. Aussies Considering Purchasing Electric Cars
According to Statista, in 2020, 56% of Australians said they’d consider buying an electric car. Even though the electric vehicle uptake rate may currently be low, recent vehicle sale figures indicate there’s growing interest among Aussies in buying any of the electric vehicles available in the country.
48% of the respondents living in Southern Australia, Victoria, Australia Capital Territory and New South Wales were considering purchasing electric vehicles in 2018, while in 2019, the number grew to 53%.
15. Why Aussies Are Considering Buying EVs
Drive and Statista established that 66% of Aussies like electric vehicles for their low carbon emissions. 54% of the respondents liked the cars for their low car running and maintenance costs, while 48% liked their excellent performance.
The leading factors discouraging Australians from buying electric vehicles were charging equipment inaccessibility (52%) and the higher cost of EVs than petrol or diesel vehicles (50%). In comparison, 45% of the respondents were concerned about their short driving ranges.
These are understandable concerns as if they want to buy a Tesla Model 3, its cost as of 2021 is 59900 AUD in Australia, exclusive of car insurance and on-road expenses.
16. Interest in Purchasing Used Electric Vehicles in 2018-2019
According to Statista, 92,000 Australians were looking to purchase a used electric car between 2018 and 2019. Between July 2018 and June 2019, the number of consumers expressing interest in purchasing second-hand cars doubled compared to the same period the previous year when only 53,000 expressed interest.
Nevertheless, the number of consumers looking to purchase a new electric car reduced over the same duration from 57,000 to 49,000.
17. Hybrid Car Sales
A study by Drive established that in 2020, hybrid car sales in Australia almost doubled. FICA numbers indicate that in 2020, 60,417 hybrid cars were bought. This denotes a 93.7% increase compared to 2019, while only 31,191 hybrid vehicles were bought.
Of the total hybrid cars bought in 2020, 54,335 were Toyotas. Four thousand four hundred five of these hybrid Toyota vehicles were bought in August 2020, more than any other new vehicle; most Australian consumers agree that the green Toyota RAV4 is the best hybrid vehicle in Oz.
18. Classic Vehicle Sales
According to Medium and 9News, Australia saw an increase in classic vehicle sales in 2021. The number of website visits and recorded sales for classic vehicle auctions in 2021 spiked, and the demand and prices aren’t expected to fall.
Vehicle Price Stats
19. Best Month To Purchase a Vehicle in Oz
Data from NRMA indicates that the best months to purchase a new vehicle in Australia are early in the year, at the end of the financial year (June), and in December. Dealerships offer incentives at the end of the year to offload all vehicles manufactured that year as, by February of the following year, the cars will be considered “last season”.
Dealers must hit annual and monthly targets to get bonuses; therefore, they have clearance deals and discounts to attract more clients.
20. Money Spent on a New Car
Reports from Canstar Blue indicate that, on average, Aussies spent 40128 AUD on a new car.
Australia’s car sales price breakdown is as follows, SUVs were the most expensive car type to own as they go for 41697 AUD each. While new Sedans cost an average of 37846 AUD, new small vehicles cost 27092 AUD.
Since Australians own their cars for an average of 6 years before upgrading or changing the model, the average yearly outlay for a new car is roughly 6700 AUD.
21. Most Expensive Vehicles in Australia
According to DMARGE and Drive, the most pricey vehicles in Australia are Ferrari hypercars and Pagani.
2018’s Australia’s luxury vehicle sales saw the addition of the Pagani Huayra Roadster in high-end car dealerships. Pagani is the most pricey road-registerable hypercar in Australia, and it goes for 5.5 million AUD, equal to the cost of six houses.
Any Australian luxury vehicle sales figures would only be complete considering the used car market. A car dealership in Perth put a 2004 Ferrari Enzo 2004 in early 2021 for 4 million AUD!
22. Used Car Statistics
A 2021 survey by DMARGE established that, on average, Aussies spend 10811 AUD for used cars. Gumtree, an online marketplace, also revealed that the used car market in Sydney was growing in early 2021.
The site’s second-hand vehicle stats, a used car in the below 200000 AUD average listing price has increased by 16%. The Northern Territory had the highest average cost of a used car on Gumtree at 11550 AUD.
Australia’s Vehicle Market
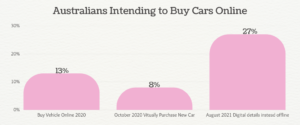
23. Australians Intending to Buy Cars Online
A study by Statista indicated that 13% of Australians intended to buy their next vehicle online in 2020.
Vehicle sales in Oz appear to be slowly turning digital since 8% of adult Aussies in an October 2020 study said they planned to buy their next car virtually.
Therefore, it is no surprise that in August 2021, 27% of Australians indicated they mainly sought digital details on vehicles, bicycles, and motorcycles instead of offline.
24. New Car Sales Stats

According to FCAI and Focus2move, Australia’s vehicle sales increased by 33.1% YOY in August 2021. The pandemic brought the whole world to a halt in 2020, which most people thought would affect vehicle sales in Oz. Initially, there was a slump; however, the sales bounced back to pre-pandemic numbers by July 2021.
The most recent sales stats indicate that 81,199 new cars were bought in August 2021. This is a 20,213 increase compared to August 2020; between January and August 2021, 732,828 vehicles were sold in Australia.
25. Australia’s Automotive Sector Market Size
According to Trading Economics and IBISWorld, Australia’s vehicle industry market size in 2021 was estimated to be 138.9 billion AUD.
In 2020, the United Nations COMTRADE database on international trade established that Oz’s car imports minus rolling stock were valued at 24.81 USD accounting for 12% of the entire imports that year.
Nevertheless, Australia’s automotive sector market is predicted to shrink by 3.7% in 2021. The yearly market size increase between 2016 and 2012 stands at -4.9%.
26 Vehicle Imports in Australia
Data from Datium Insights indicate that in March 2021, vehicle imports increased by 34% compared to 2020.
The pandemic hurt vehicle sales; Australia’s car imports reached 3.9 billion USD in March 2021. That’s a 1 billion USD increase compared to March 2020, which signals that supply chains are regaining normalcy. Estimates show that improved vehicle stocks have resulted in a 137% increase in Vehicle sales in April 2021.
Australia Vehicle Loan Stats
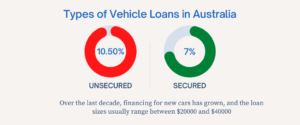
27. Types of Vehicle Loans in Australia
According to Savings, unsecured vehicle loans have the highest interest rates as they bear the highest risk to the lender. The average APR in 2021 on unsecured vehicle loans was 10.50%. On the other hand, secured vehicle loans had an average 7% APR.
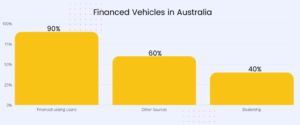
28. Financed Vehicles in Australia
The ASIC reports that 90% of all vehicle sales in Oz are financed using loans, roughly 60% financed from other sources and 40% through dealerships. Over the last decade, financing for new cars has grown, and the loan sizes usually range between $20000 and $40000.
29. New Vehicles Purchased on Loan
According to Which Car and Nationwide News, 20% of new vehicles in Australia are bought on loan. Aussie news outlets reported that 20% of the 1.1 million new vehicles purchased in 2018 were bought using loans. Aussies borrowed more than $8 billion to finance a new sweet of wheels in 2018.
Bottom Line
Even though COVID-19 might not be wholly behind us yet, it appears that it hasn’t deterred Aussies from wanting to purchase new vehicles. As per these in-depth vehicle sales stats, the car market is on its way to fully recovering.
Therefore, if you’re not in a hurry to get a new set of wheels, it would be wise to hold off on buying a new car until the prices stabilise. If you can’t get the car of your dreams, fall in love with the one you’re currently using.